
The New Global Fertilizer Map
What it can, and can't tell a field
Fertilizer statistics often create a false sense of precision.
A country may report how many tonnes of nitrogen, phosphate, and potash it consumes. But those national totals do not show how the nutrients were divided among wheat, maize, vegetables, orchards, pasture, and other land uses. They also say little about whether fertilizer reached the right soil, crop, growth stage, or rooting zone.
That information gap makes both overuse and underuse difficult to diagnose.
A new global dataset substantially improves the strategic picture. Researchers reconstructed crop-specific nitrogen, phosphorus, and potassium application rates for every country from 1980 through 2022. The work reveals sharply different fertilizer trajectories, and confirms why the world does not have one universal nutrient-management problem.
It also demonstrates an important boundary between data and agronomy. A global model can identify where to look more closely. It cannot determine what an individual field needs.
Research finding
Deepak Ray of the University of Minnesota’s Institute on the Environment developed the dataset with Tek Sapkota of CIMMYT and Achim Dobermann of the International Fertilizer Association.
Their work, published in Environmental Research Letters, assembled approximately 800,000 reported data points and used custom imputation software to construct continuous annual time series. The project took six years and approximately 20,000 lines of code.
The finished dataset estimates N, P, and K application rates for:
156 individual crops
Pastures and forests
Every country
Each year from 1980 through 2022
Ten major crops at subnational resolution in 25 agriculturally important countries
The ten gridded crops in the open circa-2020 snapshot are barley, cassava, maize, oil palm, rapeseed, rice, sorghum, soybean, sugarcane, and wheat.
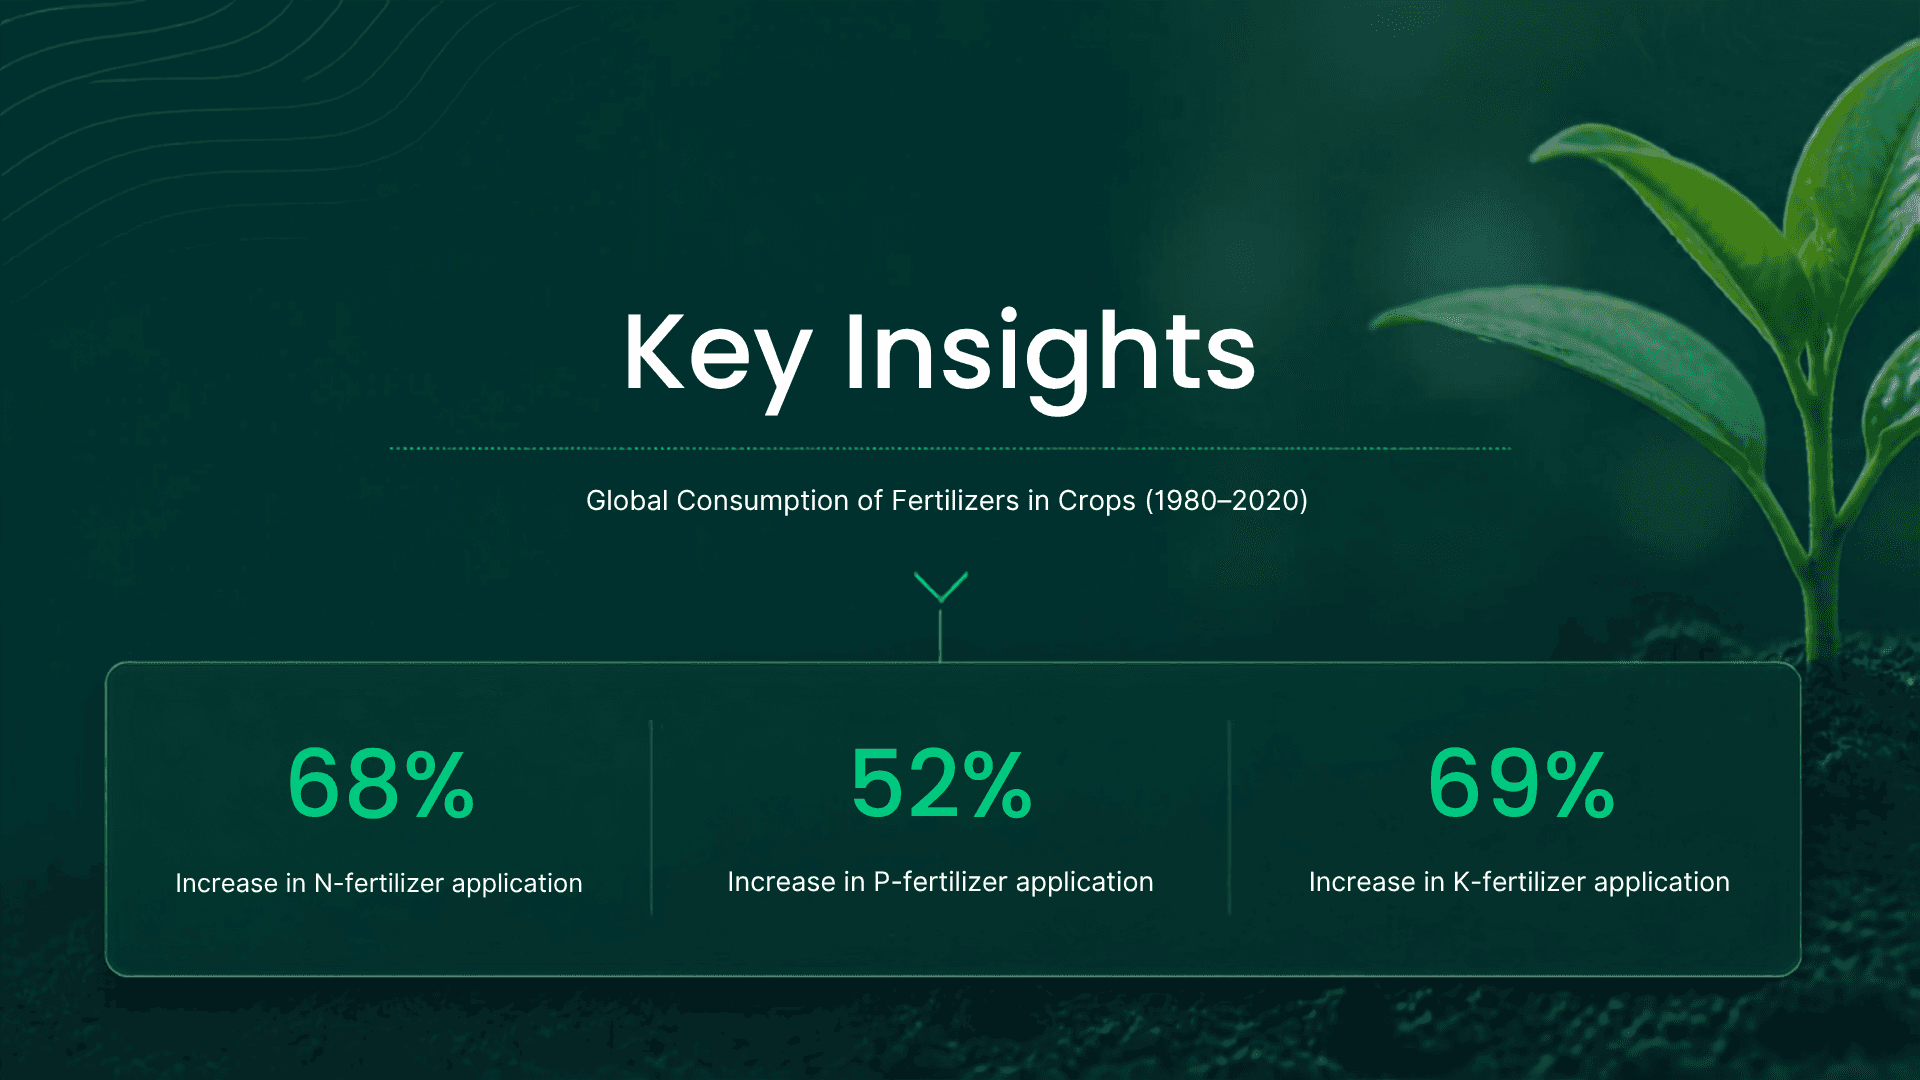
The researchers report that between 1980 and 2020, crop fertilizer application increased by 68% for nitrogen, 52% for phosphorus, and 69% for potassium. Recent growth in total N and P consumption was driven more by expansion in harvested area than by increasing rates per hectare. Potassium growth reflected both expanding area and higher rates.
That distinction matters commercially. Greater total fertilizer demand does not necessarily mean that existing farmers are applying more per field. It can instead reflect more hectares under fertilized production.
Regional differences remain extreme. Nitrogen-application rates vary more than tenfold between the highest- and lowest-input regions. Areas with historically high rates, including parts of Europe and China, have moved toward lower application. Countries such as Ethiopia and Vietnam have moved upward from much lower starting points, while much of sub-Saharan Africa still uses very little fertilizer.
The peer-reviewed research and University of Minnesota Global Fertilizer Use Dataset project frame these patterns as different phases of fertilizer development rather than one global trend.

What the imputation means
The dataset’s achievement is also its main limitation.
Direct observational data account for only approximately 0.5%–1% of the country–crop–year combinations needed to construct the full record. The remaining values were estimated.
The researchers used a three-step process. Long-term fertilizer-use-by-crop information established a baseline. Observations for exact years were preserved. Estimated values were then adjusted so that country totals matched reported agricultural fertilizer consumption.
Unlike several earlier reconstructions, the model did not rely on economic proxies such as gross domestic product. That avoids one possible source of indirect bias.
It does not turn estimated values into measurements.
An imputed maize-N rate is the model’s best reconstruction from incomplete evidence. It should carry more confidence where observations are numerous and consistent, and less where fertilizer markets, informal distribution, crop allocation, or reporting are poorly documented.
The dataset is therefore best suited to regional comparisons, historical analysis, market planning, environmental modeling, and identifying data gaps. Treating each value as an exact application record would exceed the evidence.
Agronomic interpretation
Application rate is not the same as nutrient supply to the plant
Nitrogen fertilizer may contain urea, ammonium, nitrate, or mixtures. Its recovery depends on placement, rainfall, irrigation, temperature, volatilization, immobilization, nitrification, denitrification, leaching, roots, and crop demand. Finding the right balance is therefore about more than the amount of nitrogen applied; nitrogen status and crop demand need to be interpreted together.
Phosphorus may be applied at an apparently generous rate yet remain poorly available because of calcium precipitation in alkaline soil or adsorption by iron and aluminum oxides in acidic soil. Conversely, a low annual P rate may be adequate temporarily where a substantial legacy pool exists and roots can access it.
Potassium can remain in soil solution, occupy exchange sites, become fixed between clay layers, or be released from minerals. Crop removal differs enormously between grain-only harvest, forage, potatoes, sugar crops, and residue-removal systems.
This distinction between total nutrient reserves and immediately available nutrients is also important when interpreting soil tests. Total digestion soil testing, for example, can reveal nutrient reserves that conventional extractable tests may not show.
Organic amendments add further uncertainty. Manure, compost, digestate, crop residue, irrigation water, and biological fixation may supply nutrients outside the mineral-fertilizer dataset. The fraction becoming available during the crop season depends on composition and environmental conditions.
A high regional fertilizer rate therefore does not prove overfertilization. It might accompany high removal, low native supply, intensive multiple cropping, or poor recovery. A low rate does not prove efficiency; it can indicate limited access, low profitability, or severe nutrient mining.
The dataset reveals the input pattern. It does not, by itself, reveal the soil–plant outcome.
Possible management implication
The most useful application is hierarchical.
At global and national levels, the dataset can identify crops and regions where nutrient use is changing rapidly, where supply chains may be vulnerable, or where environmental and agronomic investigation should be prioritized.
At regional level, it can provide a benchmark. Are reported fertilizer rates moving up or down? Which nutrients and crops drive the change? Is increased consumption caused by intensification or additional hectares?
At field level, that benchmark must be replaced by measurements:
Soil nutrient status by relevant depth and extraction method
pH, salinity, texture, organic matter, CEC, and carbonate status
Mineral and organic nutrient inputs
Fertilizer source, rate, timing, placement, and application quality
Soil moisture, temperature, rainfall, and irrigation
Rooting restrictions and field variability
Yield, crop quality, and nutrient removal
Residual fertility, losses, and economic return
Plant sap analysis can be particularly useful in this field-level context because it provides information about nutrients currently moving through the plant rather than relying solely on what has been applied to the field. Tracking plant sap over time can help identify nutrient deficiencies, excesses, imbalances, and antagonisms before they become visible in the crop.
Where possible, recommendations should be tested in replicated strips or zones. Yield response—not conformity with a regional average—determines whether an additional unit of fertilizer paid.
Limitations and unknowns
This was a data-reconstruction and trend-analysis study, not a randomized fertilizer experiment. It establishes no crop sufficiency thresholds, economic optimum rates, fertilizer-recovery efficiencies, or causal yield responses.
National and subnational estimates can conceal farm-level variability. They may also miss differences in fertilizer formulation, placement, organic inputs, irrigation-water nutrients, crop residue management, and product quality.
The complete 1980–2022 dataset and software are available through licensing, free for academic research. An open circa-2020 snapshot is archived on Dryad. Commercial users should also recognize that the International Fertilizer Association was a project partner; the work remains a peer-reviewed scholarly reconstruction, but the institutional relationship is relevant context.
Recommendation
Use the dataset to establish context and improve questions—not to set field rates.
A regional estimate can show that a crop’s fertilizer use appears unusually high, low, or rapidly changing. Soil, plant, weather, application, and yield data must then determine whether the field is deficient, inefficient, balanced, or accumulating nutrients.
Nitrogen provides a good example. Applied N alone does not reveal whether the crop is using that nitrogen efficiently. Combining plant sap and soil analysis can provide a much more direct feedback loop for adjusting nitrogen management, including identifying opportunities to reduce unnecessary applications and losses.
Plant sap data can take that feedback loop further. Rather than waiting for visible deficiency symptoms, growers can monitor what nutrients the plant is actually taking up and use those trends alongside soil, weather, application, and yield data.
This is where Measure → interpret → recommend → act → monitor becomes essential. A model can reveal the broader pattern. Field measurements determine whether that pattern applies. Controlled action tests the recommendation, and monitoring shows whether nutrient uptake, yield, crop quality, losses, and profitability actually improved.
Nutrient balance can also affect outcomes beyond yield. For example, monitoring excess free nitrate and ammonium through plant sap analysis can provide another perspective on nitrogen management, while nutrient management and plant disease resistance are increasingly being considered together when evaluating overall crop health.
The practical insight is that better global data narrows the search. It does not eliminate the need to ask the crop and soil what happened.
Sources
Ray, Deepak K.; Sapkota, Tek B.; and Dobermann, Achim. “Diverse trajectories of global fertilizer use in the post-Green Revolution period.” Environmental Research Letters, 2026.
University of Minnesota Institute on the Environment. Global Fertilizer Use Dataset, 2026.
University of Minnesota. First-of-its-kind fertilizer study reveals where world can boost food production and cut pollution, Sept. 14, 2026.
Ray, Sapkota, and Dobermann. “N-P-K fertilizer application rates by crop and country for circa 2020.” Dryad, 2025.

Written by
Buse Soysal
Related
Other Articles.
Can Vetch Catch Crops Improve Greenhouse Vegetables and Reduce Fertilizer

by
Buse Soysal
Best Practices
Fertiliser Recommendation
Nutrient Interactions
Soil Health
Slurry Injection Saves Nitrogen But What Does It Cost Elsewhere?

by
Buse Soysal
Best Practices
Nutrient Interactions
Soil Health
Fertilizers
Soil Testing
Precision Agriculture
Turning lab report into a fertiliser recommendation

by
Buse Soysal
Fertiliser Recommendation
Unlocking Hidden Nutrients with Total Digestion Soil Tests
by
Buse Soysal
How to Balance a High Bacterial to Fungal Ratio in your Soil
by
Buse Soysal
Soil Health
Magnesium: The Unsung Hero of Photosynthesis
by
Buse Soysal
Nutrient Interactions
Nitrogen: The Builder
by
Buse Soysal
Plantsap
Unlocking Smarter Farming with Weather + Nutrient Analytics

by
Buse Soysal
Nutrient Interactions
Water Meets Nutrient Strategy

by
Buse Soysal
Nutrient Interactions
Calcium: The Architect
by
Buse Soysal
Plantsap
Potassium: The Logistics Manager

by
Buse Soysal
Plantsap
Phosphorus: The Strategist
by
Buse Soysal
Plantsap
Unit Conversion Meets Crop Intelligence

by
Buse Soysal
Soil Testing
Soil Biology Testing—What Are Your Options?
by
Buse Soysal
Soil Testing
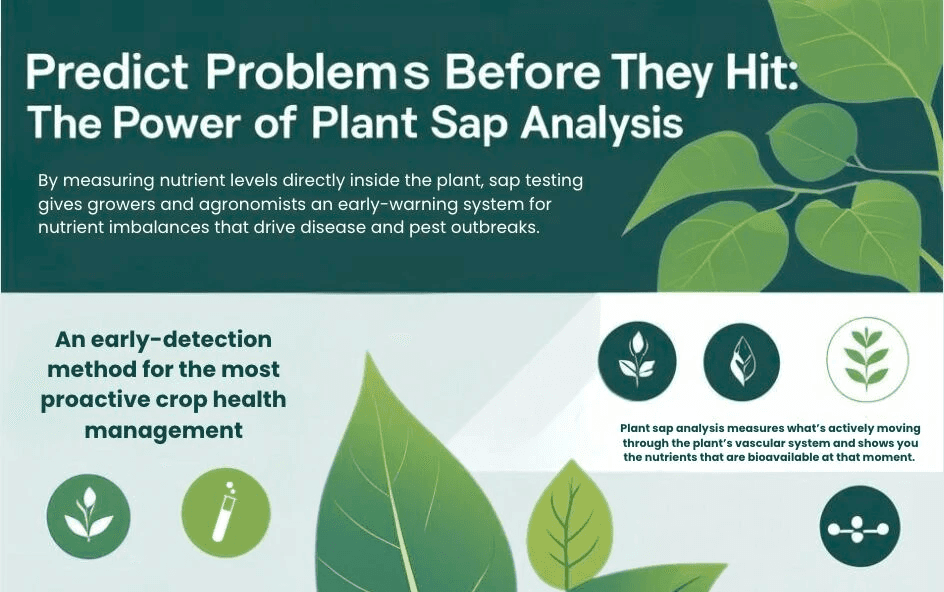
Predict Problems Before They Hit — The Power of Plant Sap Analysis
by
Buse Soysal
Data Analytics
Maximizing Cover Crop Benefits for Your Cash Crop

by
Buse Soysal
Nutrient Interactions
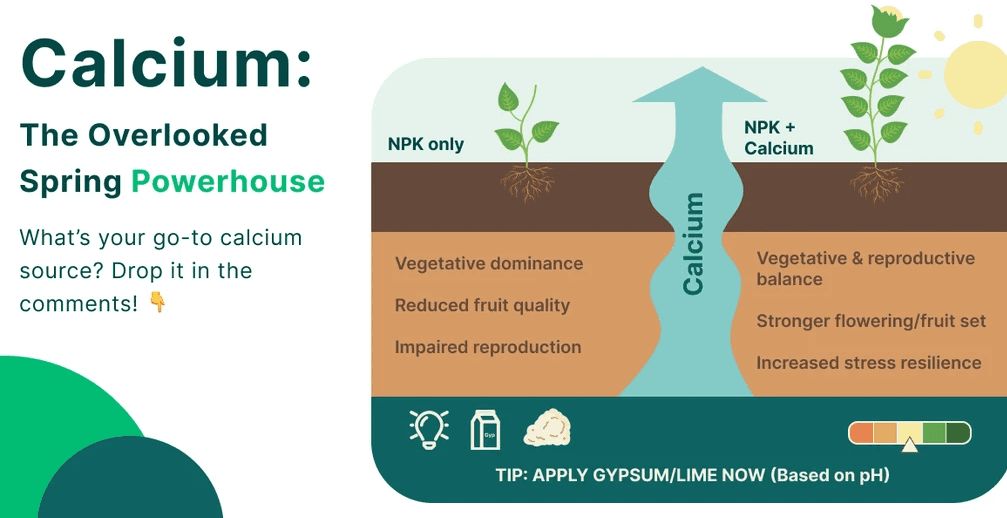
Calcium: The Overlooked Spring Powerhouse
by
Buse Soysal
Nutrient Interactions
Are fertilizer costs cutting into your bottom line?
by
Buse Soysal
Fertilizers
Advancing Precision Irrigation: Leveraging Technology for Sustainable Agriculture

by
Buse Soysal
Soil Health
Unlocking Agriculture’s Hidden Helpers: Microbial Genomics and the Data Challenge

by
Buse Soysal
The importance of microbial amendments: How to increase overall crop resilience

by
Buse Soysal
Soil Health
Unlocking Crop Potential: The Untapped Power of Plant Sap Analysis

by
Buse Soysal
Regenerative Agriculture
Unlocking Carbon Credits: What Data Farmers Need to Track and How We Can Help

by
Buse Soysal
Data Analytics
Enhancing Weed Management: Leveraging Data Analytics for Sustainable Agriculture
by
Buse Soysal
Data Analytics
Elevating Crop Health with Brix Measurements: The Sweet Science of Plant Immunity

by
Buse Soysal
Soil Health
Nutrient Management and Disease Resistance: Unveiling the Hidden Connections Through Data Analytics

by
Buse Soysal
Base Saturation Balancing: Achieving the Ideal Ratio for Optimal Crop Production

by
Buse Soysal
Soil Health
How to Achieve Zero Excess Free Nitrates and Ammonium in Plant Sap Analysis

by
Buse Soysal
Regenerative Agriculture
America's Buzzing Backbone: The Crucial Role of Migratory Beekeeping in U.S. Agriculture

by
Buse Soysal
Soil Health
Breaking Down Soil Biology Testing - Finding the ROI with PLFA Tests

by
Buse Soysal
Soil Testing
Precision Agriculture: Revolutionizing Farming, One Field at a Time

by
Buse Soysal
Precision Agriculture
Ag101: What is the difference between organic and regenerative agriculture?
by
Buse Soysal
Soil Health
Your Favourite Beans are in Danger: Threats to Coffee & Chocolate Production
by
Buse Soysal
Soil Health
IPM Programs: Best of the Pest Prevention Measures

by
Buse Soysal
Pest & Disease
Wet Spring Issues - Why So Irreparable?

by
Buse Soysal
Nutrient Interactions
The Influence of Nutrient Applications on Post Harvest
by
Buse Soysal
Nutrient Interactions
Orange Juice in Danger: The Threat of HLB Disease

by
Buse Soysal
Soil Health
California Dreaming: The Issue with Almond Production

by
Buse Soysal
Sight Unseen: Zinc Deficiency in Soil

by
Buse Soysal
Nutrient Interactions
Battle Beneath: Understanding Calcium - Potassium Antagonism in Soil

by
Buse Soysal
Nutrient Interactions
The Plant Kingdom's Power Couple: Nitrogen and Sulfur's Synergistic Symphony

by
Buse Soysal
Nutrients for Beginners
Increase Drought Tolerance With This Commonly Missed Micronutrient

by
Buse Soysal
Climate Change
Digging Deeper: The Great Soil Analysis Debate for Regenerative Agriculture

by
Buse Soysal
Soil Health
Ammonium vs Calcium: The Nutrient Balancing Act for Thriving Plants

by
Buse Soysal
Nutrient Interactions
Improving Soil Structure: Boost Your Farm’s Resilience
by
Buse Soysal
Soil Health
Sodium and Calcium Relationship: A Tale of Frenemies in the Soil

by
Buse Soysal
Nutrient Interactions
The Soil Office: Molybdenum and Nitrate's Tumultuous Relationship
by
Buse Soysal
Nutrient Interactions
The Delicate Dance: Achieving the Perfect Nitrogen Balance for Optimal Crop Productivity

by
Buse Soysal
Nutrient Interactions
Paving the Way for a Regenerative Future: Insights into the "Data Driven Regenerative Ag" Project

by
Buse Soysal
Regenerative Agriculture
Unlocking Soil's Full Potential: The Pioneering Principles of Dr. William A. Albrecht

by
Buse Soysal
Soil Health
The Benefits of Regenerative Agriculture for Human Health

by
Buse Soysal
Regenerative Agriculture
Responsible Data Exchange in Agriculture

by
Buse Soysal
Data Analytics
Responsible Fertilizer Use for Mitigating Drought

by
Buse Soysal
Climate Change
The Power of Healthy Soil: for a Happy World Earth Day

by
Buse Soysal
Soil Health
Crop Scouting for Regenerative Agriculture
by
Buse Soysal
Regenerative Agriculture
Plantsap and Soil Analyses for Nitrogen Emission Reduction
by
Buse Soysal
Regenerative Agriculture
How do you use Plant Nutrition for Regenerative Agriculture?

by
Buse Soysal
Regenerative Agriculture
Profitability of Regenerative Agriculture and Transition Management

by
Buse Soysal
Regenerative Agriculture
How can we use Data-Driven Farming for a Bright Future?
by
Buse Soysal
Data Analytics
Plantsap Analysis for More Yield and Less Fertilizer

by
Buse Soysal
Regenerative Agriculture