Compare results and track trends

Interpret connected farm data to guide better recommendations.

Compare measurements across time, crops and management zones alongside targets, observations and applications. Use the analytical context when reviewing prescriptions and advisor plans, and compare later measurements with completed activities during follow-up.

Agronomist reviewing crop performance in the field
SoilBeat compare results and track trends interface
See the pattern, not just the number

Can I overlay what I applied on the trend?

Yes. View recorded field activities and observations alongside nutrient measurements to see when an application happened relative to later soil or plant sap results. This adds timing and field context to the trend, but a change alone does not prove the application caused it; sampling conditions, weather and crop stage also matter.

See what is changing

Follow nutrient measurements over time instead of reading each result as an isolated snapshot.

Compare like with like

Compare fields, crops, dates and management zones without rebuilding the analysis each time.

Focus on what matters

Use targets, filters, tables, heatmaps and maps to narrow attention to the most relevant signals.

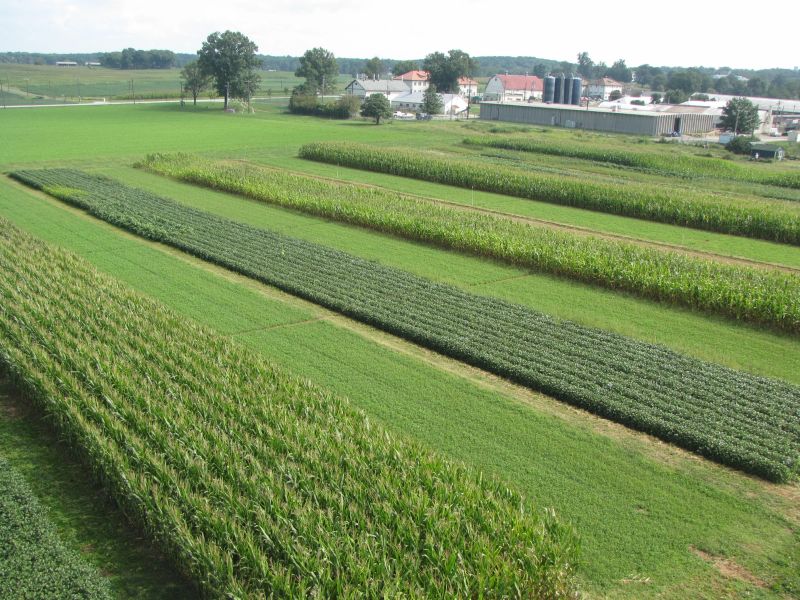
Crop sampling and field measurement
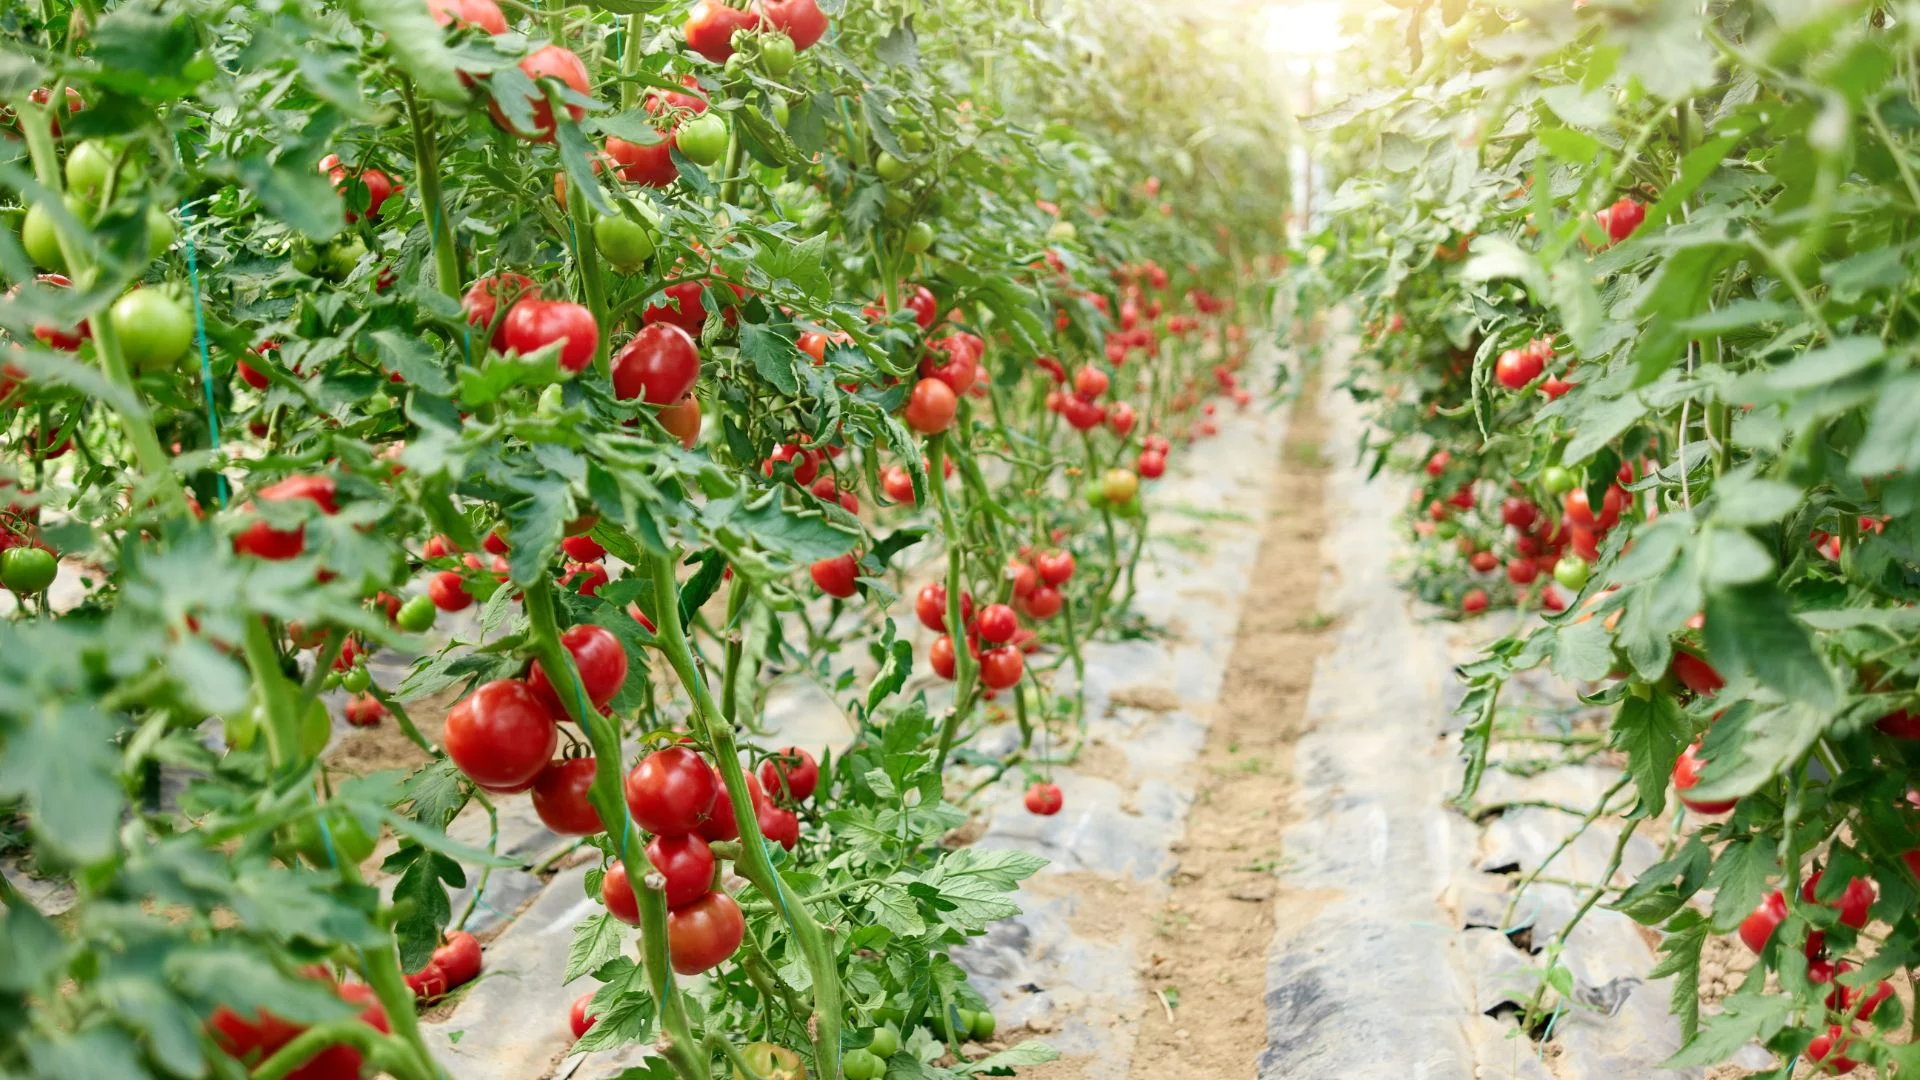
Greenhouse crop monitoring
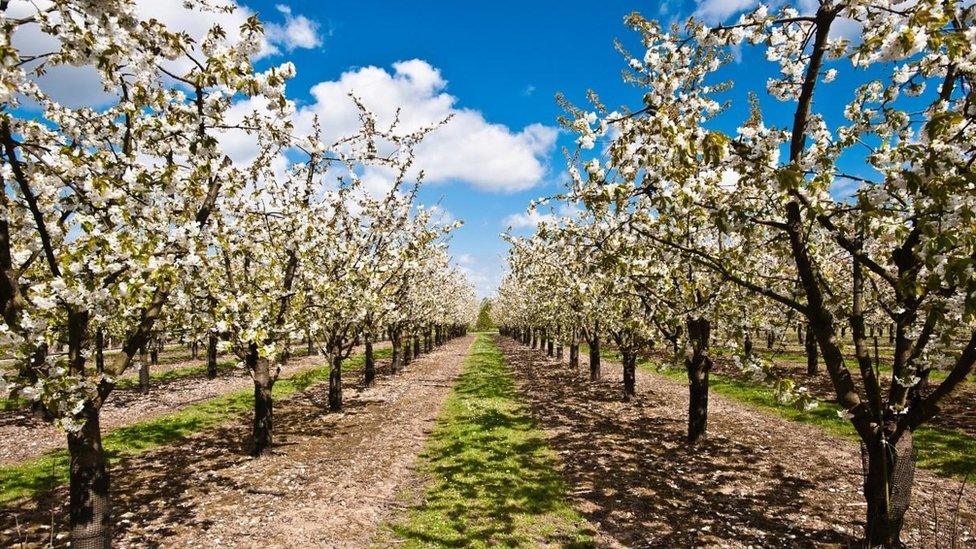
Orchard crop analysis
Nutrient timelines

How do I see nutrient trends over time?

Select the nutrient, sample type and date range to bring repeated soil or plant sap measurements into one timeline. SoilBeat shows how results change between sampling dates alongside crop context, observations and activities; check that laboratory methods, units and sampling conditions are comparable before treating a movement as a meaningful trend.

Nutrient trends over time
Multiple sampling dates
Observation overlays
Activity overlays
Crop-stage context
Chart export
SoilBeat nutrient timeline analytics
SoilBeat targets and nutrient comparisons
Targets & comparisons

How do I compare a result with target values?

Compare the selected measurement with a standard target or an agronomist-defined target suited to the crop, sample type and growth stage. SoilBeat brings targets and previous results into the analytical view, helping you identify values that need investigation while checking that the target uses the same method and units.

Target values
Custom agronomic targets
Previous-sample comparison
Zone-to-zone comparison
Crop comparison
Test-type comparison
Agronomic filters

How do I focus on the measurements that matter?

Use agronomic filters to select the elements, dates and relationships relevant to the question, then inspect the results in charts, tables or heatmaps. Narrowing the view helps you compare the same evidence from different angles while keeping laboratory method, units, crop context and sampling period in mind.

Agronomist-defined filters
Element selection
Date-range filtering
Data tables
Heatmaps
Custom graph views
SoilBeat agronomic filters and heatmaps
SoilBeat maps and spatial agronomic analytics
Maps & spatial views

How do I compare zones or fields?

Compare nutrient measurements across management zones using maps, tables and charts, then inspect the field or zone where a difference appears. SoilBeat keeps sampling locations and crop context connected to the results; compare compatible test methods, units and dates before treating spatial differences as a reason to change an application.

Management-zone maps
Spatial nutrient comparison
Cross-field analysis
Zone-level drill-down
Sampling-location context
Map-based comparison
From insight to decision

How do I use these insights in my next decision?

Make more of the data you already collect

Ready to compare your farm results?

Bring your existing measurements into SoilBeat, compare them in context and turn the patterns you see into better agronomic decisions.

Compare results and track trends

Interpret connected farm data to guide better recommendations.

Compare measurements across time, crops and management zones alongside targets, observations and applications. Use the analytical context when reviewing prescriptions and advisor plans, and compare later measurements with completed activities during follow-up.

Agronomist reviewing crop performance in the field
SoilBeat compare results and track trends interface
See the pattern, not just the number

Can I overlay what I applied on the trend?

Yes. View recorded field activities and observations alongside nutrient measurements to see when an application happened relative to later soil or plant sap results. This adds timing and field context to the trend, but a change alone does not prove the application caused it; sampling conditions, weather and crop stage also matter.

See what is changing

Follow nutrient measurements over time instead of reading each result as an isolated snapshot.

Compare like with like

Compare fields, crops, dates and management zones without rebuilding the analysis each time.

Focus on what matters

Use targets, filters, tables, heatmaps and maps to narrow attention to the most relevant signals.

Crop sampling and field measurement
Greenhouse crop monitoring
Orchard crop analysis
Nutrient timelines

How do I see nutrient trends over time?

Select the nutrient, sample type and date range to bring repeated soil or plant sap measurements into one timeline. SoilBeat shows how results change between sampling dates alongside crop context, observations and activities; check that laboratory methods, units and sampling conditions are comparable before treating a movement as a meaningful trend.

Nutrient trends over time
Multiple sampling dates
Observation overlays
Activity overlays
Crop-stage context
Chart export
SoilBeat nutrient timeline analytics
SoilBeat targets and nutrient comparisons
Targets & comparisons

How do I compare a result with target values?

Compare the selected measurement with a standard target or an agronomist-defined target suited to the crop, sample type and growth stage. SoilBeat brings targets and previous results into the analytical view, helping you identify values that need investigation while checking that the target uses the same method and units.

Target values
Custom agronomic targets
Previous-sample comparison
Zone-to-zone comparison
Crop comparison
Test-type comparison
Agronomic filters

How do I focus on the measurements that matter?

Use agronomic filters to select the elements, dates and relationships relevant to the question, then inspect the results in charts, tables or heatmaps. Narrowing the view helps you compare the same evidence from different angles while keeping laboratory method, units, crop context and sampling period in mind.

Agronomist-defined filters
Element selection
Date-range filtering
Data tables
Heatmaps
Custom graph views
SoilBeat agronomic filters and heatmaps
SoilBeat maps and spatial agronomic analytics
Maps & spatial views

How do I compare zones or fields?

Compare nutrient measurements across management zones using maps, tables and charts, then inspect the field or zone where a difference appears. SoilBeat keeps sampling locations and crop context connected to the results; compare compatible test methods, units and dates before treating spatial differences as a reason to change an application.

Management-zone maps
Spatial nutrient comparison
Cross-field analysis
Zone-level drill-down
Sampling-location context
Map-based comparison
From insight to decision

How do I use these insights in my next decision?

Make more of the data you already collect

Ready to compare your farm results?

Bring your existing measurements into SoilBeat, compare them in context and turn the patterns you see into better agronomic decisions.

Analytics questions

What should I know before comparing results?

Can I set my own target values?

Yes. SoilBeat supports agronomist-defined target values as well as standard targets where appropriate. Choose targets that match the crop, growth stage, sample type, laboratory method and units, then review how each measurement compares; a target provides context for interpretation rather than an automatic instruction to apply a particular product or rate. Explore the advisor workflow.

Can I compare results from different labs?

Yes, when the results measure comparable parameters using compatible methods and units. Check the extraction or analytical method, sample type, sampling depth or plant part and reporting basis before comparing; converting units alone does not make different laboratory methods equivalent, so ask your agronomist when the methods or interpretation differ. Check supported laboratory reports.

Can I export charts?

Yes. You can export SoilBeat graphs as images to share an analytical view with your grower, advisor or team. Keep the nutrient, units, sampling dates and relevant crop or zone context with the chart when discussing it; structured laboratory data can also be exported to Excel for further work. Explore the underlying farm record.

Can I filter the results before comparing them?

Yes. Agronomic filters let you focus on selected elements, date ranges and relationships, then inspect the evidence in charts, tables or heatmaps. Use the filters to narrow the question and check sample type, method and units as well, so the apparent pattern is based on results that can sensibly be compared. See how laboratory results are organized.

Does a change prove an application worked?

No. A nutrient trend shows how the measured values changed, while activity overlays show when recorded applications and observations occurred. Weather, crop growth, sampling conditions and laboratory methods can also affect the comparison, so review the wider field context with your agronomist before attributing a change to one treatment or repeating it. Connect measurements with field activities.

Grow with SoilBeat!

SoilBeat connects farm data to expert-reviewed prescriptions and advisor plans, with field activities and follow-up in the same record.

Download the SoilBeat app

The app is available in English, Dutch, German, Spanish and French.

Privacy settings
SoilBeat Logo

Copyright © 2026

Grow with SoilBeat!

SoilBeat connects farm data to expert-reviewed prescriptions and advisor plans, with field activities and follow-up in the same record.

Download the SoilBeat app

The app is available in English, Dutch, German, Spanish and French.

Privacy settings
SoilBeat Logo

Copyright © 2026

Grow with SoilBeat!

SoilBeat connects farm data to expert-reviewed prescriptions and advisor plans, with field activities and follow-up in the same record.

Download the SoilBeat app

The app is available in English, Dutch, German, Spanish and French.

Privacy settings
SoilBeat Logo

Copyright © 2026